

Online Forums
Technical support is provided through Support Forums below. Anybody can view them; you need to Register/Login to our site (see links in upper right corner) in order to Post questions or issues. You do not have to own a commercial license in order to use the OPC Labs support. Our team is actively monitoring the forums, and provides replies as soon as possible.
Please read Rules for forum posts before reporting your issue or asking a question. OPC Labs team is actively monitoring the forums, and replies as soon as possible.
Various technical information can also be found in our Knowledge Base. For your convenience, we have also assembled a Frequently Asked Questions page.
Do not use the Contact page for technical issues.
VB.NET application crashes after upgrade to QuickOPC-UA
please have a look at the picture attached (you can extract the same from the dump file by opening it in Visual Studio).
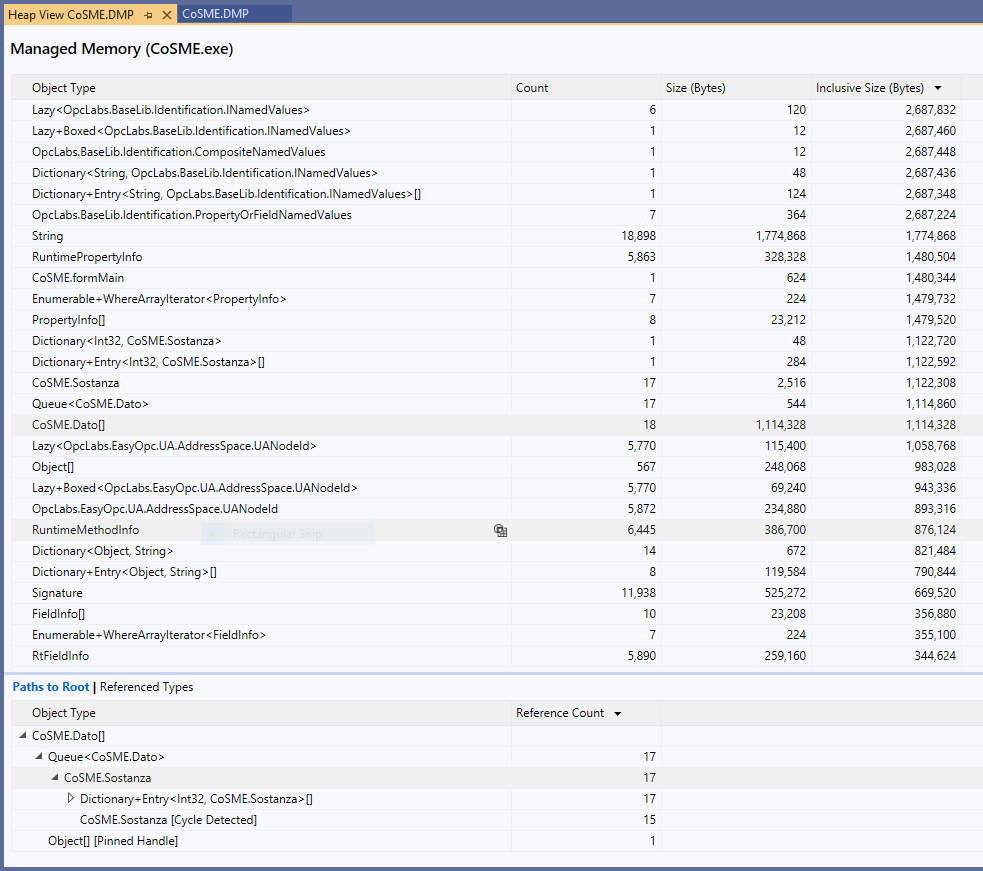
The managed objects that can be seen there (sorted from largest to smallest) do not amount to any huge memory consumption. Grouped by the type of object, each type's instances consume max several megabytes, and total won't be larger than tens of megabytes. Also note that the column with "inclusive" size effectively counts the same memory multiple times, but in order to get the total amount consumed, the non-inclusive sizes should be added together.
The largest pieces are QuickOPC objects that represent the list of "standard" NodeIds. I know what they are; but the absolute byte count is't that big, and I am confident that they do not grow over time. Next come some types that are of your own making.
I now regret that I have not instructed you to make *two* memory dumps, separated by several hours in between. That would allow to better see if any of the types is consuming increasingly more. If you can still do that, please do so.
But I am afraid that it is actually *not* the managed (.NET) memory consumption that is growing inside the process. Then, however, it would most likely not be QuickOPC responsibility, because QuickOPC (for OPC UA) uses purely managed code (the part for OPC Classic has some native code but you are not using it). Further investigations in that direction will mostly likelu involve running PerfMon with more counters - those for "total" process memory (Private Bytes) as before, and then some .NET memory counters - to verify that the information from the minidump is correct.
Regards
Please Log in or Create an account to join the conversation.

The overall RAM usage was about 50% of system memory.
Thank you
Please Log in or Create an account to join the conversation.
how long (roughly) after process start has this memory dump been taken?
Any idea how much memory it appeared to consume at that time in Task Manager or PerfMon?
Thank you
Please Log in or Create an account to join the conversation.
I apologise for this late reply, we tried to setup a development environment on the production site, but I was not feasible at the end.
So, we collected a dump file with Windows Task Manager, and I kindly ask you if you could check it. You may download it from here:
seafile.aethia.net/f/0092e3a6215a419b8ff9/?dl=1
Thank you very much,
Gianpaolo Perego
Please Log in or Create an account to join the conversation.
If you can run your program under Visual Studio, you can also do the steps below - with the result that the dump will be smaller but still contain what we need:
1. Break the program at convenient point (when it has run long enough to show the issue).
2. Perform the Debug -> Save Dump As command.
3. In the Save Dump As dialog, make sure that the Save as type is set to Minidump with Heap (*.dmp). Select file name and location, and press the Save button.
Send us the minidump file for analysis.
Regards
Please Log in or Create an account to join the conversation.
thank you. Yes, this has the symptoms of a true memory leak somewhere - can be caused by our code, or yours.
If you can create an app that would not depend on thew rest of your setup and would that would the same problem (e.g. with some freely accessible OPC server or our own demo server), please do so and we will it investigate it here.
If that is not doable, please take a full dump of the process after some time it is running (when it is clear that amount of unnecessary allocations are staying around), zip it, and send it to us (if it is too big to attach to the forums, use alternative means such as Dropbox - or I can our FTP server access). We will then try to analyze the memory dump here.
For information about how to take the dumps, see e.g:
- blogs.msdn.microsoft.com/debugger/2009/12/30/what-is-a-dump-and-how-do-i-create-one/
- support.m-files.com/index.php?/Knowledgebase/Article/View/24...ific-process-with-task-manager
The easiest is probably with the Task Manager.
Best regards
Please Log in or Create an account to join the conversation.
thank you very much for the explanation, I'm sorry I meant just to ask about how to export the data.
I collected the requested statistics for many hours (1 point every 60 secs), and it clearly seems that private and virtual bytes (red and green lines) are continously increasing. Please, check this in the image attached.
Do you have any suggestion?
Thank you,
Gianpaolo
Please Log in or Create an account to join the conversation.
Google: www.google.com/search?q=performance+monitor+tutorial .
Basically, you just need to:
1. Type PerfMon into Windows search box, and select "Performance Monitor" from the list offered.
2. In Performance Monitor window, click on the Performance Monitor node in the tree on the left side.
3. Click the green "+" icon.
4. Under "Available Counters", expand "Process", select "Private Bytes", "Virtual Bytes" and "Handle Count" (multiple items can be selected with help of Cttl key). Then, under "Instances of selected object", select your application, and press "Add >>", and "OK".
5. From now on, you can view the counters in the graph. We are interested in whether or not there is an unlimited growth in any of them. When you right-click on the graph and select Properties and switch to General tab, you can change how often the data is sampled and how long the duration is. If needed, you can then send me the screenshot, or - the data can also be stored in to a file - for which I refer you to the tutorials.
Best regards
Please Log in or Create an account to join the conversation.
I entered a reply but it doesn't appear here...
I was asking how to report to you the data collected through the Performance Monitor, sorry but I don't know this tool very well.
Thank you
Please Log in or Create an account to join the conversation.
thank for update.
You proceeded faster than I thought. I wanted to give you some instructions as to what to monitor. From what you are writing, it looks like that you are observing something like Windows, system-wide memory available memory. That's not quite what we want (although, to some degree, it is also indicative of something).
What is needed are performance counters specific to the process in which QuickOPC runs (= your application).
In Performance Monitor, under "Available Counters", expand "Process", select "Private Bytes", "Virtual Bytes" and "Handle Count" (multiple items can be selected with help of Cttl key). Then, under "Instances of selected object", select your application, and press "Add >>", and "OK".
Best regards
Please Log in or Create an account to join the conversation.