Professional OPC
Development Tools

logos

Online Forums

Technical support is provided through Support Forums below. Anybody can view them; you need to Register/Login to our site (see links in upper right corner) in order to Post questions. You do not have to be a licensed user of our product.

Please read Rules for forum posts before reporting your issue or asking a question. OPC Labs team is actively monitoring the forums, and replies as soon as possible. Various technical information can also be found in our Knowledge Base. For your convenience, we have also assembled a Frequently Asked Questions page.

Do not use the Contact page for technical issues.

(Internal) Long running test results

More
03 Dec 2017 19:49 - 03 Dec 2017 19:51 #5705 by Georges
interesting.
Last edit: 03 Dec 2017 19:51 by Georges. Reason: not the good place

Please Log in or Create an account to join the conversation.

More
10 Oct 2017 06:06 - 10 Oct 2017 06:28 #5579 by support
This is an evaluation of the results.
The test has been primarily done to confirm or rule out a presence of handle leak.

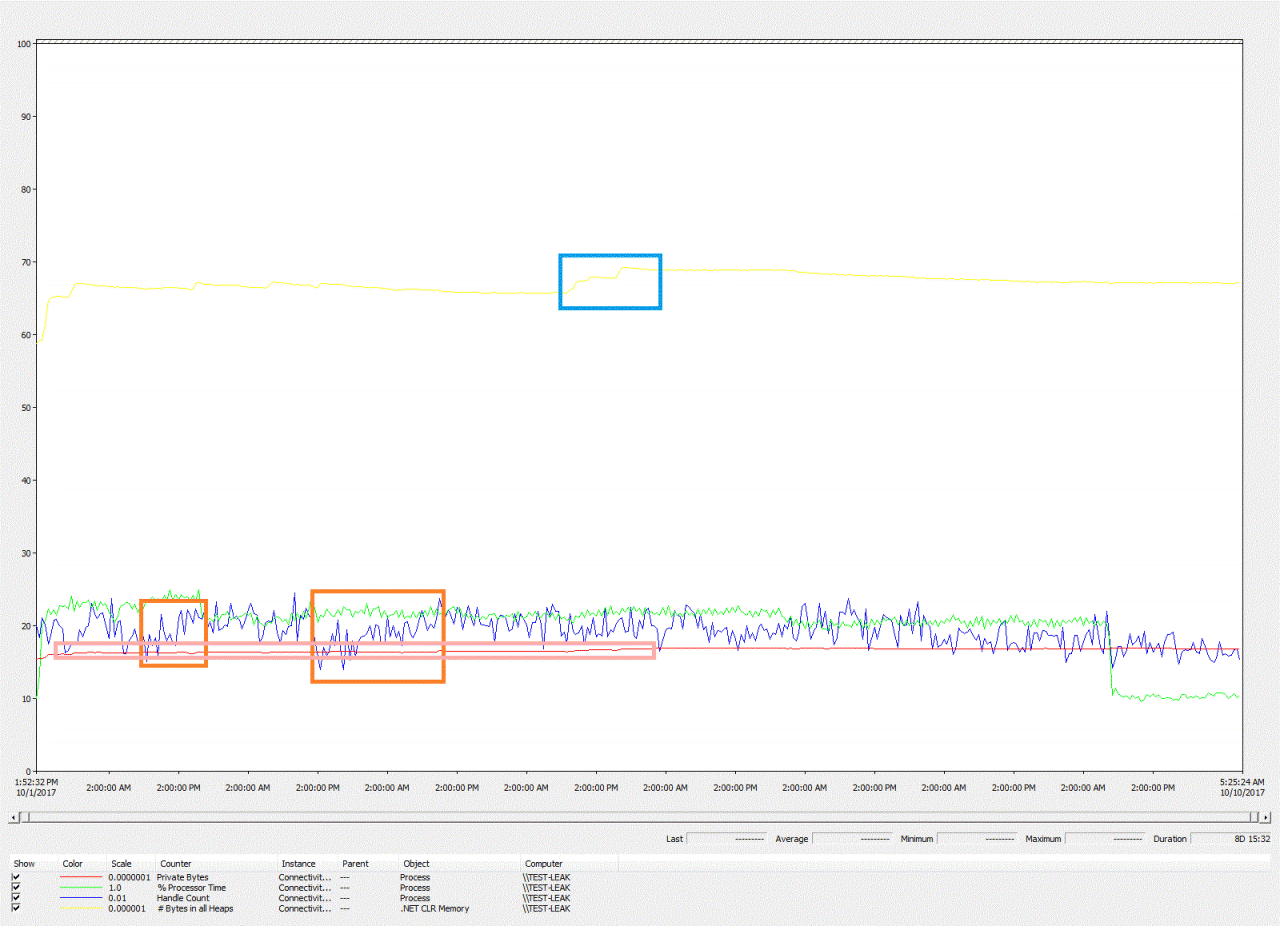
PerfMon image, annotated (click to enlarge) follows.


Test outcome: Passed. No Handle Count, Private Bytes, or # Bytes in all Heaps leak found. Also, % Processor Time stays reasonable during the test run.

It is important to note the necessity of performing and evaluating leak tests over long periods of time. Specifically, periods like 36 hours may not be enough to obtain understanding of the trends.

The thick rectangles in the image mark "suspicious" periods which would be interpreted as a leak if observed separately or over a period not significantly longer than the occurrence itself - but they represent no real leak. For example, there is:
  • A "# Bytes in all Heaps" (yellow line, cyan rectangle) growth lasting over 12 hours, with no immediate compensation afterwards. But it slowly compensates itself over the next 4 days.
  • Two "Handle Counts" growths (blue line, orange rectangles), in duration cca 12 hours and 24 hours (!), with no apparent compensation. But an overall look at the chart over the 9 days shows that there is no leak.
  • A small "Private Bytes" growth (red line, pink rectangle) over the period of cca 4.5 days (!), which then stabilizes itself for the remainder of the test.

There are many factors that contribute to such behavior, but specifically the fact that .NET memory is *managed* and the garbage collector *non-deterministic* must be interpreted for what they truly mean.
Attachments:
Last edit: 10 Oct 2017 06:28 by support.

Please Log in or Create an account to join the conversation.

More
10 Oct 2017 05:40 - 10 Oct 2017 06:21 #5578 by support
This is an internal topic.
Attached is a result of 9-day test with Connectivity Explorer (5.50.405.1), 2600 rows of live data.

Note 1: The network disruptions were triggered by a script - 120 seconds on, 120 seconds off.

Note 2: The period at the end where the CPU usage goes down is after we manually stopped the script that caused periodic network disruptions (and we let the network be functional).

Evaluation will follow in a separate post.
Attachments:
Last edit: 10 Oct 2017 06:21 by support.

Please Log in or Create an account to join the conversation.

Moderators: support
Time to create page: 0.051 seconds